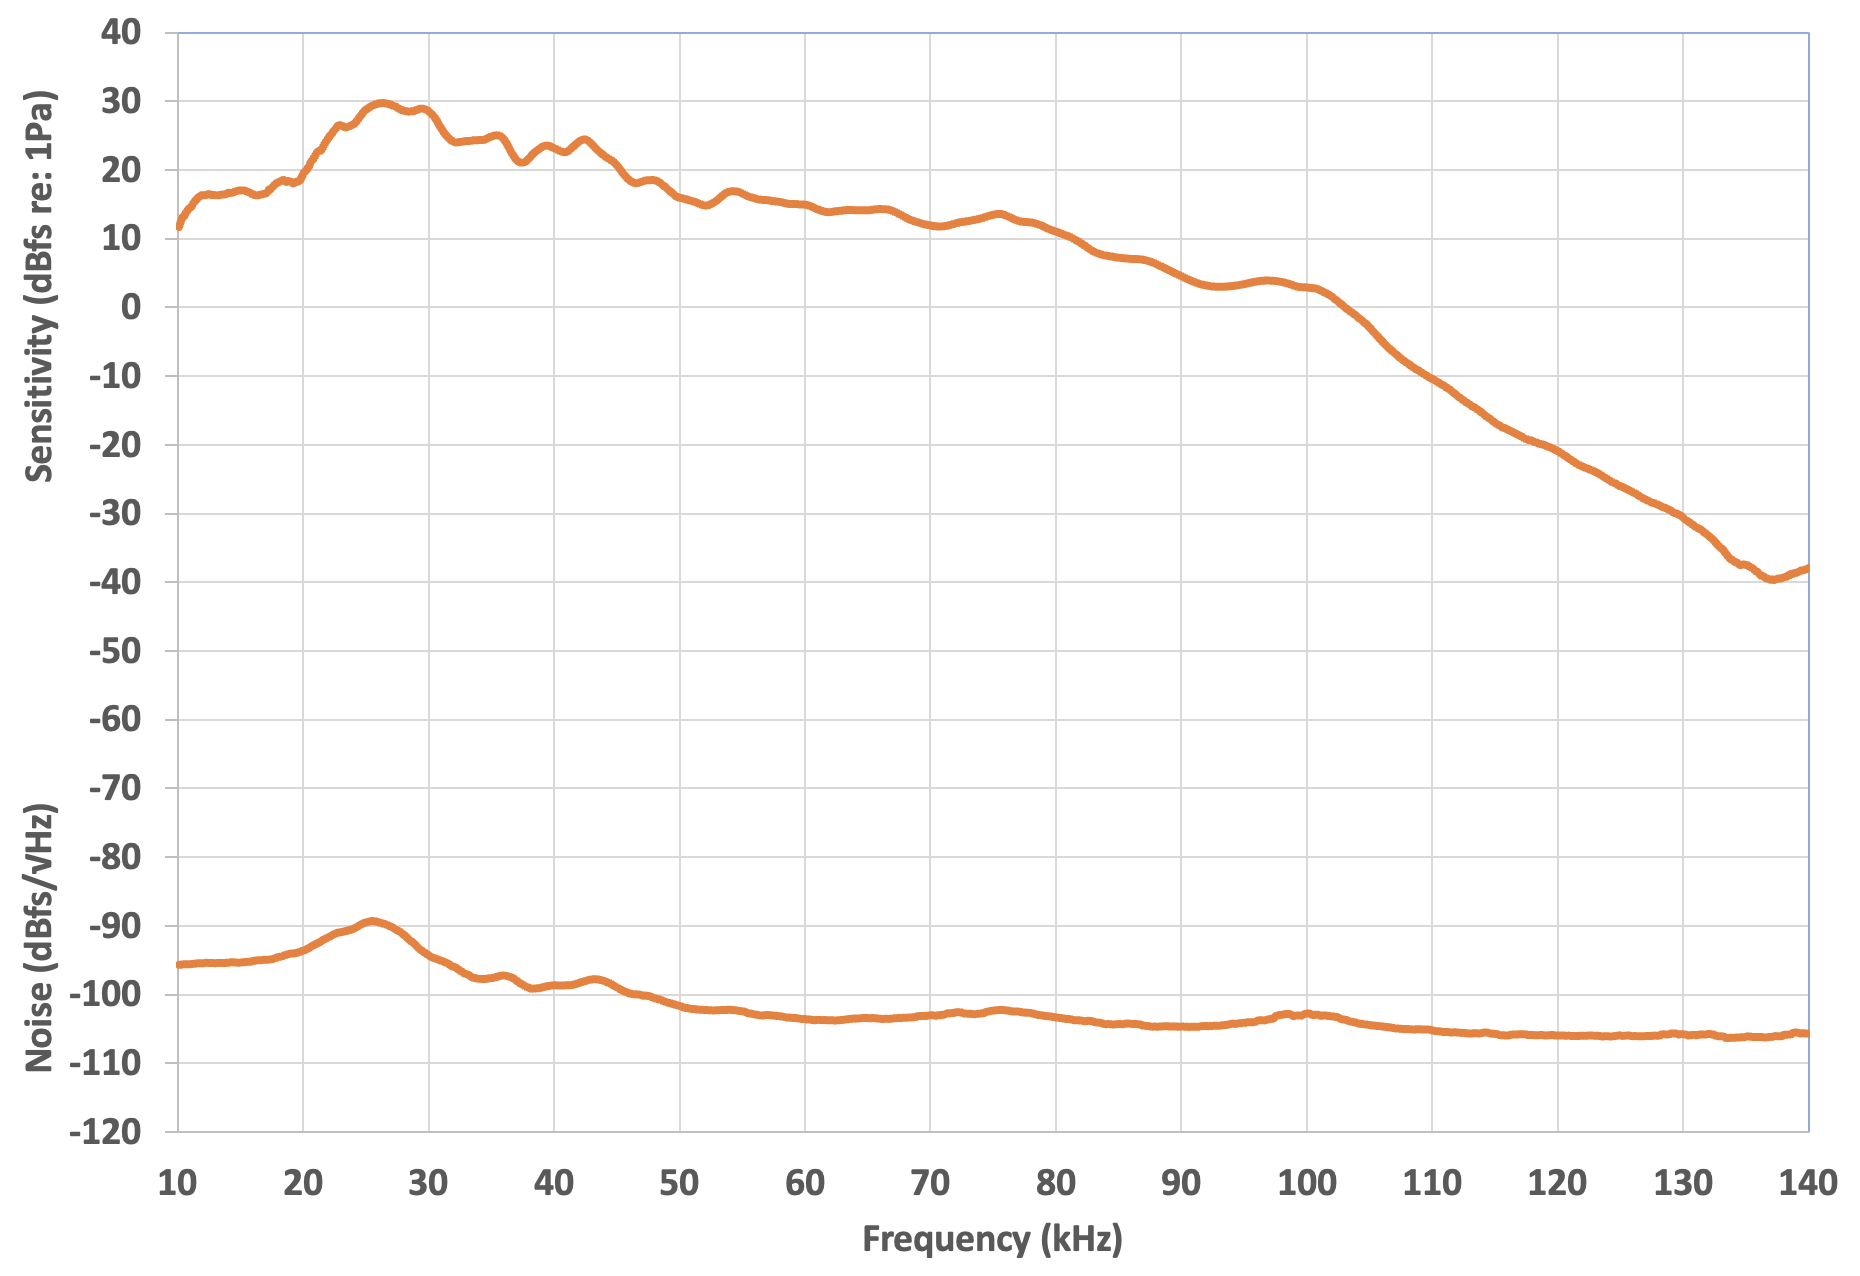
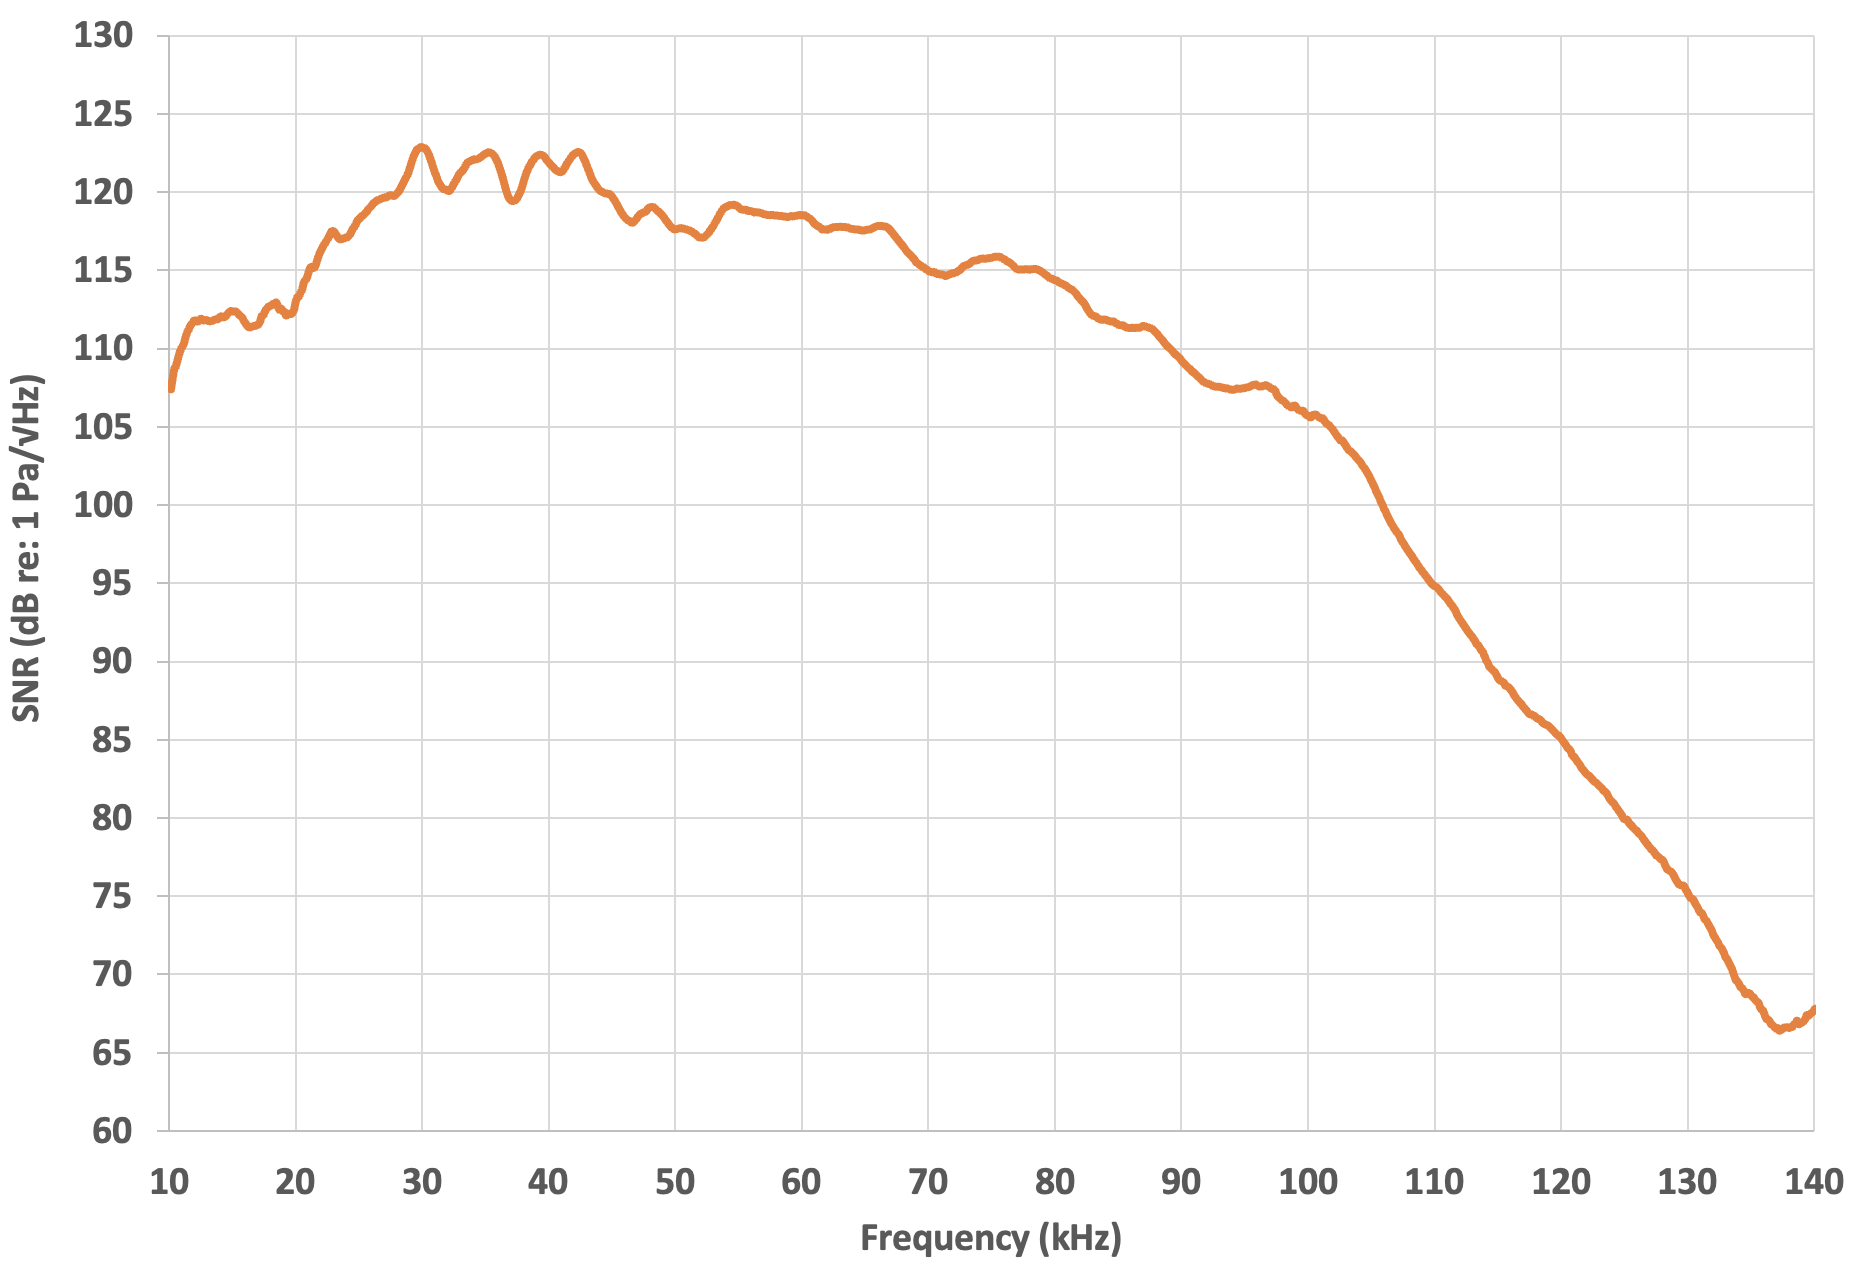
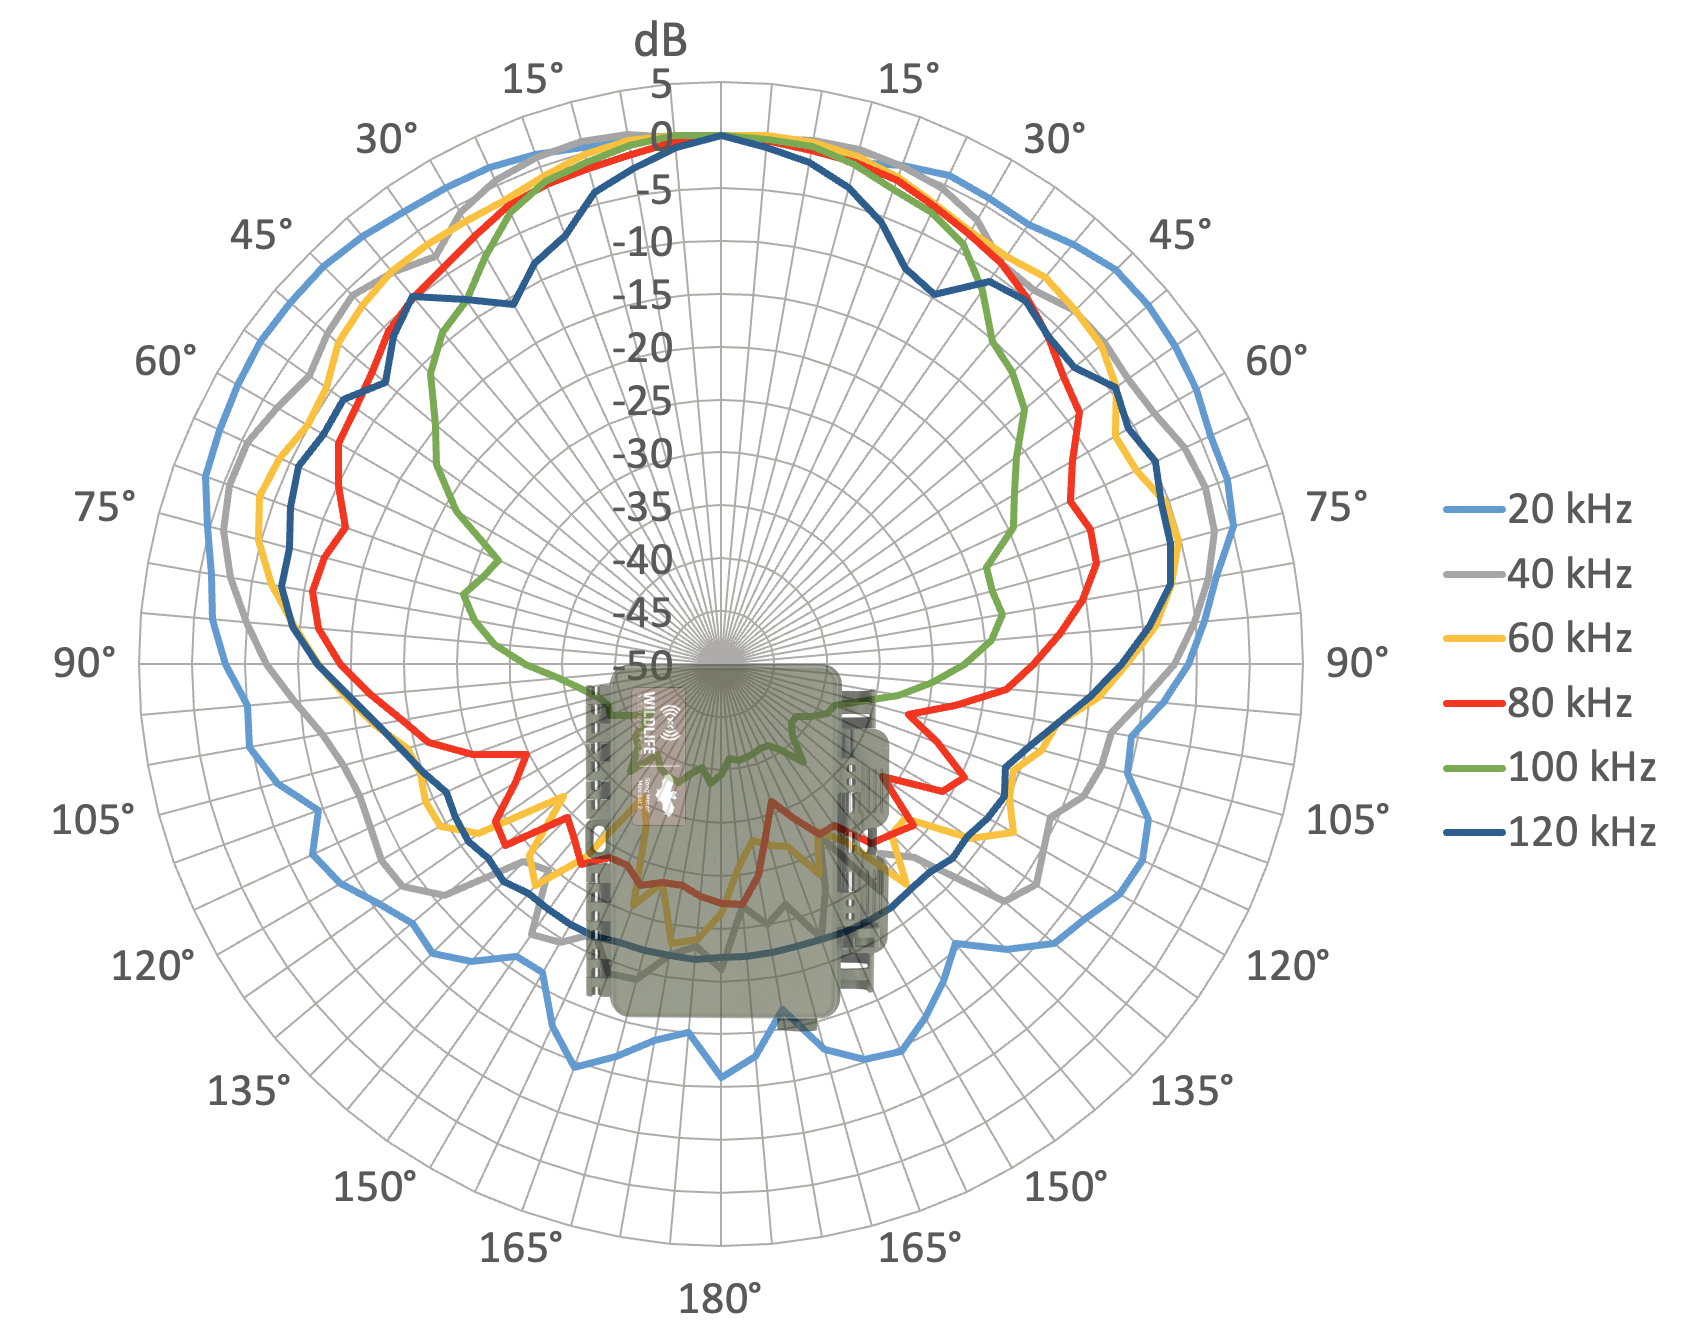
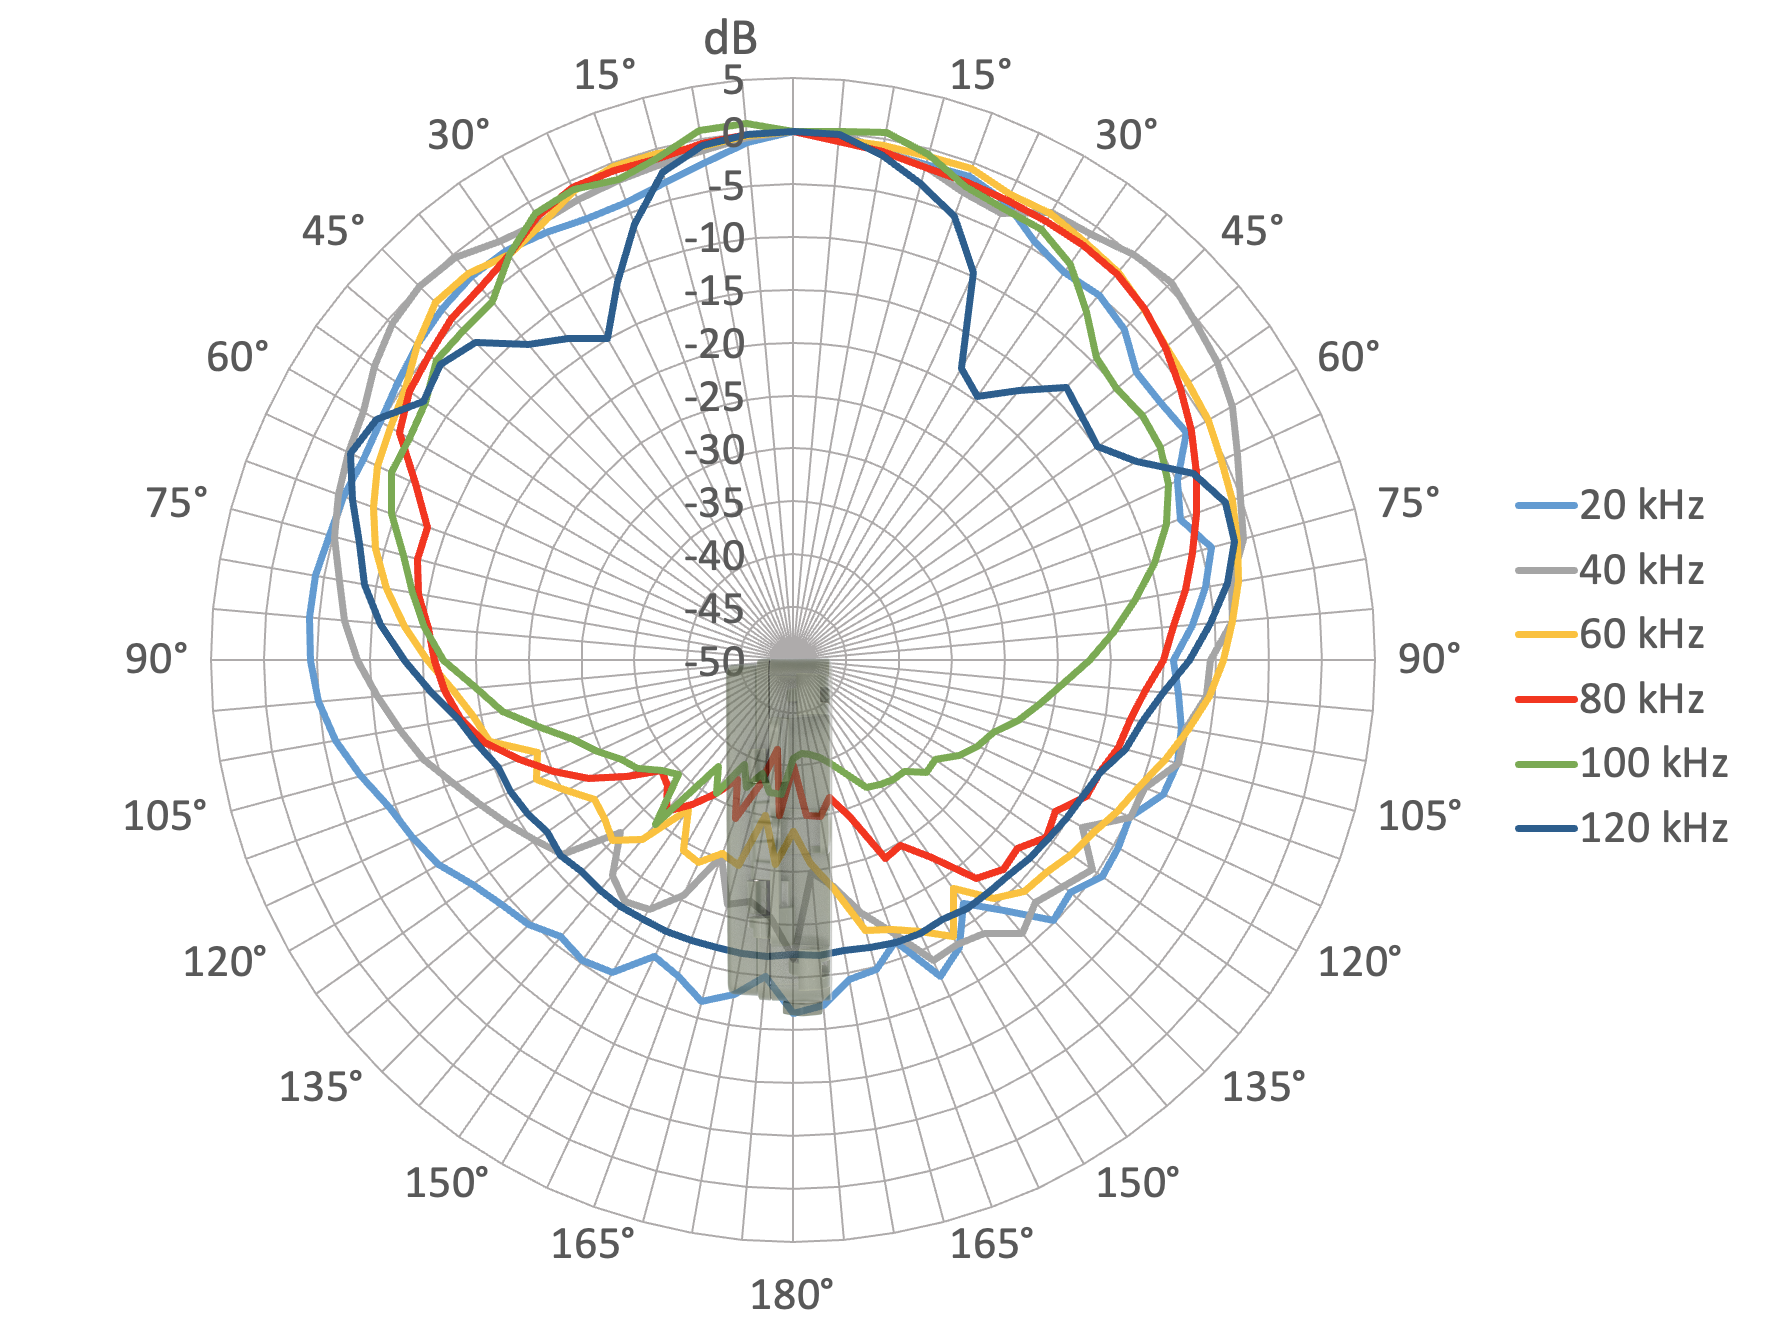
Ultrasonic Microphone Specifications

All measurements taken with default gain settings, unless otherwise stated.

Figure 1. Ultrasonic Microphone Sensitivity and Noise Floor
Sensitivity (dBFS re: 1Pa) and Noise (dBFS per square root Hz) shown between 10 kHz and 140 kHz. The sensitivity peaks at 30 dBFS/Pa at 26 kHz. Sensitivity declines roughly linearly to 3 dBFS/Pa at 100 kHz, and declines more steeply to -40 dBFS/Pa at 135 kHz. Noise is highest at -90 dBFS/root Hz at 26 kHz. It declines to -100 dBFS/root Hz at 50 kHz. It declines slowly to -105 dBFS/root Hz at 140 kHz.
Figure 2. Ultrasonic Microphone Signal-to-Noise Ratio
Signal-to-Noise Ratio (in dB re:1 Pa/root Hz) plotted versus Frequency from 10 kHz to 140 kHz. SNR is at its highest, between 113 and 123 dB, between 20 kHz and 80 kHz. Between 80 kHz and 140 kHz it declines to 67 dB.
Figure 3. Ultrasonic Microphone Polar Response: Front View
Polar response chart, displayed radiating out from the recorder, which is facing the viewer. The Song Meter Mini Bat 2's ultrasonic microphone has a roughly cardioid response pattern, with the response of higher frequencies generally becoming more directional. At 20 kHz, the 180 degree sensitivity is 15 dB less than head-on. At 100 kHz, the 180 degree sensitivity is 40 dB less than head-on.
Figure 4. Ultrasonic Microphone Polar Response: Top View
Polar response chart, shown with the recorder latch facing the viewer. The polar response is slightly lopsided, with slightly more off-axis sensitivity towrds the rear of the recorder than towards the front, but the general response is still cardioid in shape.