All product user guides can now be found at our brand new Knowledge Base.
Replaying recordings of animal vocalizations is always a thrill. The sounds of the wild can be beautiful, stirring, even shocking. But when it comes to the scientific study of these sound recordings (known as bioacoustics), listening to sound is, unfortunately, one of the least useful ways to perform a scientific analysis.
Analyzing vocalizations by ear can be a time-consuming process. And how would you know precisely when a call occurred, at what amplitude or frequency, and under what circumstances?
That’s why sound visualization tools—namely, oscillograms and spectrograms—are so crucial. By creating a tangible view of wildlife sounds, you can see vocalizations as they occur through time.
Let’s explore these tools and how they can be used to get the precision you need as a wildlife biologist.
What is an Oscillogram?
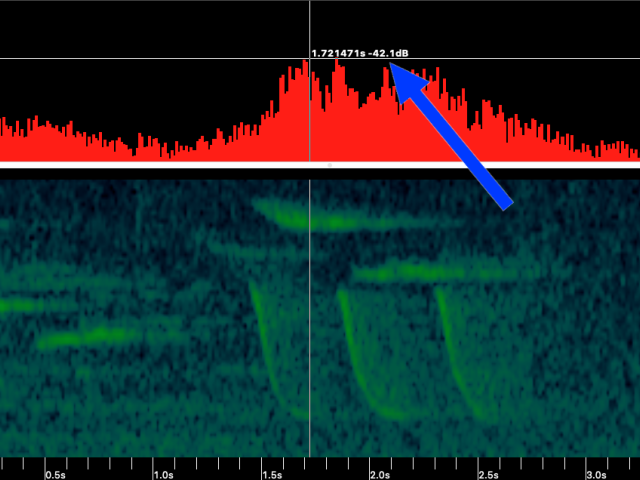
An oscillogram is a visual representation of sound data that explains the relationship between time and amplitude.
The vertical axis represents amplitude, while the horizontal axis represents elapsed time in seconds. Each point along the waveform represents relative amplitude in decibels (dB), meaning the tool allows you to see and measure how amplitude changes over time from loud to soft.
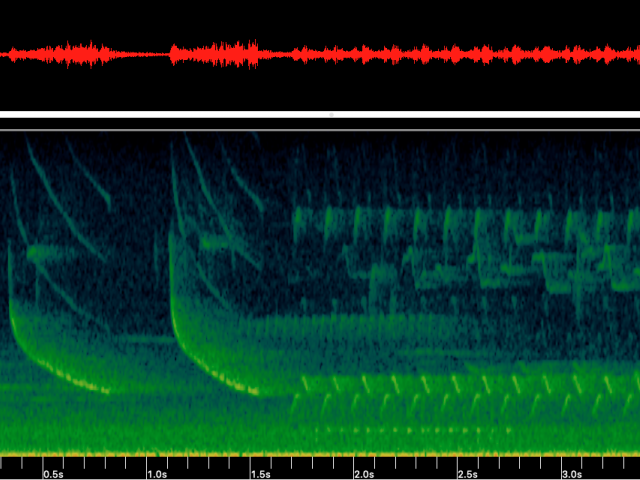
What is a Spectrogram?
A spectrogram provides a view of amplitude and frequency over time.
Like an oscillogram, it shows elapsed time along the horizontal axis, but with the added dimension of frequency. Frequency is displayed in Hertz (Hz) along the vertical axis, and amplitude is represented by variations in color indicating the intensity of the vocalization that occurred.
Which tool is best for sound visualization?
When making an oscillogram versus spectrogram comparison, it’s not a question of what the visualization tools cannot do, but rather a question of what they can do. And while you might be quick to assume that the spectrogram is superior because it shows the added dimension of frequency (dB), this isn’t always the case.
An oscillogram allows you to get a closer look at points of interest. For example, if you want a precise measurement of amplitude (dB) changes, an oscillogram provides the most granular view. If you attempted to zoom in to the sample level and retrieve the same detailed information from a spectrogram, it would be much more difficult.
But that’s not to say a spectrogram is an inferior tool. In fact, it’s often a favorite among wildlife biologists because it provides a dimensional view of the recorded sound. By viewing frequency (Hz) on a spectrogram, you can more easily discern between vocalizations at high and low frequencies, helping you more quickly identify your target species and narrow your focus as you parse through recordings.
For instance, songbird frequencies are higher than those emitted by owls; so if you are studying songbirds, higher frequency vocalizations in your sonogram would be your focus.
In truth, neither the oscillogram nor spectrogram is necessarily better than the other; they are simply different tools for different jobs. Each can provide equally valuable information, depending on the requirements of your research.
Get started with acoustic analysis
Wildlife Acoustics Kaleidoscope® Pro Analysis Software shows correlated views of an oscillogram and spectrogram. That is, the graphics are displayed together, allowing you to see both simultaneously while reviewing sound recording files.
You can perform your own oscillogram or spectrogram analyses for bats and other wildlife, or automate analysis, letting your computer do the work for you. For example, Kaleidoscope Pro’s Cluster Analysis tool applies pattern-recognition algorithms that scan recordings for animal vocalizations. Once detected, these sounds are sorted into groups of similar sounds called “clusters.” From here, clusters can be labeled for species inventory or annotated to create classifiers that can be run on additional recordings.
Kaleidoscope also features a useful, time-saving tool for bat researchers. Its Bat Auto-ID function analyzes bat echolocations and suggests the most likely bat species in the recording. (It also provides an efficient workflow for manually vetting these identifications, reducing the amount of time you spend on analysis.
If you're ready to learn more, check out a free virtual training or any one of our Kaleidoscope video tutorials. Happy recording!
Join our mailing list to get notified about upcoming training opportunities, live webinars, quarterly grant offerings, product releases, and more.
Thank you for signing up to our mailing list.
You can unsubscribe or change your email settings at any time by clicking "Manage Preferences" link at the bottom of any mailing list emails we send you.